The Problem
Despite cancer being one of the leading causes of death, diagnosing it is so elusive that there is no accurate, non-invasive diagnostic tool and no effective early detection tool exists. This is because cancer is heterogeneous and finding biomarkers seems futile most of the time.
Currently, diagnosing cancer is invasive. It is done through a biopsy, in order to extract a specimen and analyze it at a laboratory. And it is often too late.
The Solution
We apply phylogenetics, a well-established and proven method in many scientific fields such as Botany and Zoology, to analyze cancer data. This scientific and evolutionary method accounts for the heterogeneity of cancer, and produces biologically meaningful classification, i.e., group together biologically related patients.
Our platform utilizes the principles of phylogenetics to reveal susceptibility to cancer development (or other physiological or pathophysiological conditions), diagnosis and typing of cancer, identifying stages of cancer, as well as post-treatment evaluation.
We have created a patented software solution which transforms cancer data to identify under and/or overexpressed gene values or in the case of sera, (i) novel or (ii) vanished mass spec peaks, and peaks signifying (iii) up or (iv) down regulated proteins and scores the variations as either derived or ancestral. The transformation process does not reduce the data size and preserves all biologically meaningful components of cancer data.
In addition to the patented algorithm and use of an evolutionary method to analyze cancer data, we have spent many years developing two processes to universally diagnose cancer patients and provide the earliest possible detection of the decease. In essence, our method (algorithm + processes) applies to all cancer types and provides early detection which saves lives and resources.
The advantage of our method is that it is not restricted to a panel of biomarkers for individual specific cancers. This method is sensitive to all types of cancers. Our method looks at all biological manifestations found in the serum and provides the ability to monitor disease progression and tailor the treatments such as the case of treatment for primary or metastatic cancer.
This is the fastest, easiest, cheapest, and most accurate cancer detection and diagnosis.
Clinical Study
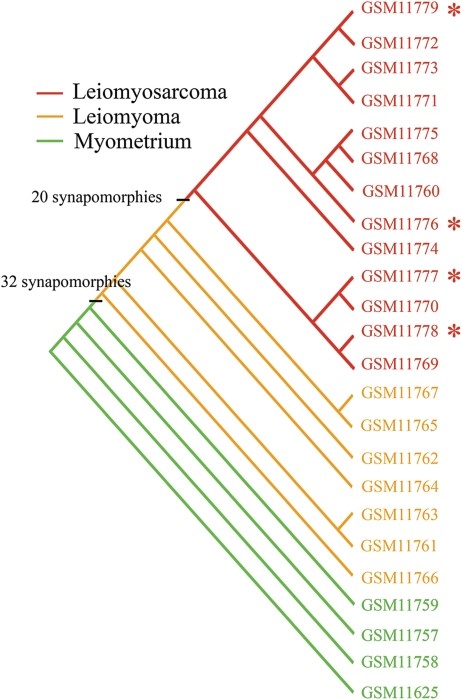
As part of our research and development, we have applied our method on multiple datasets and published more than a dozen papers in peer-reviewed journals.
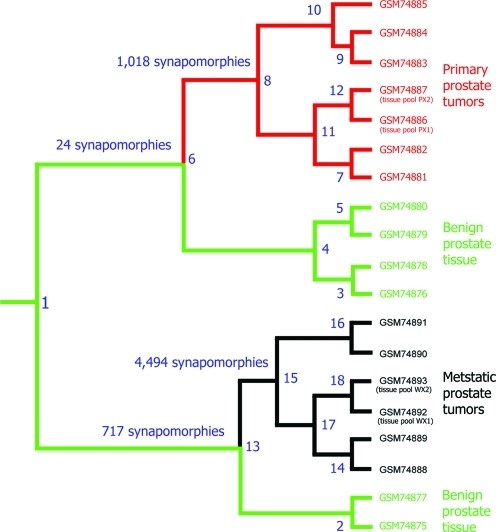
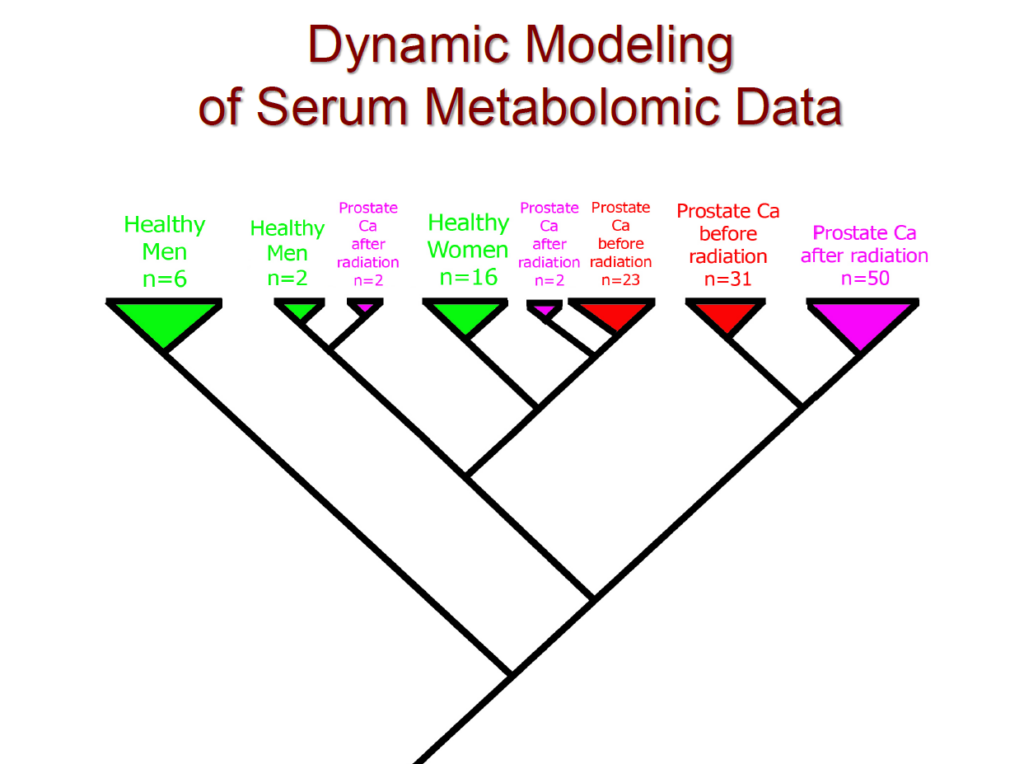
In addition, we conducted a clinical study of prostate cancer: We analyzed the data from 78 patients: 16 healthy women, 8 healthy men, 54 cancer patients before radiation, and the same 54 cancer patients after radiation. The cladogram below, a tree-like representation of patients’ clusters or evolutionary relationships, represents the placement of these patients in the clinical study. Please note the 100% separation of healthy and cancerous patients, in addition using nothing but the serum our method was able to separate women from men.
Operations
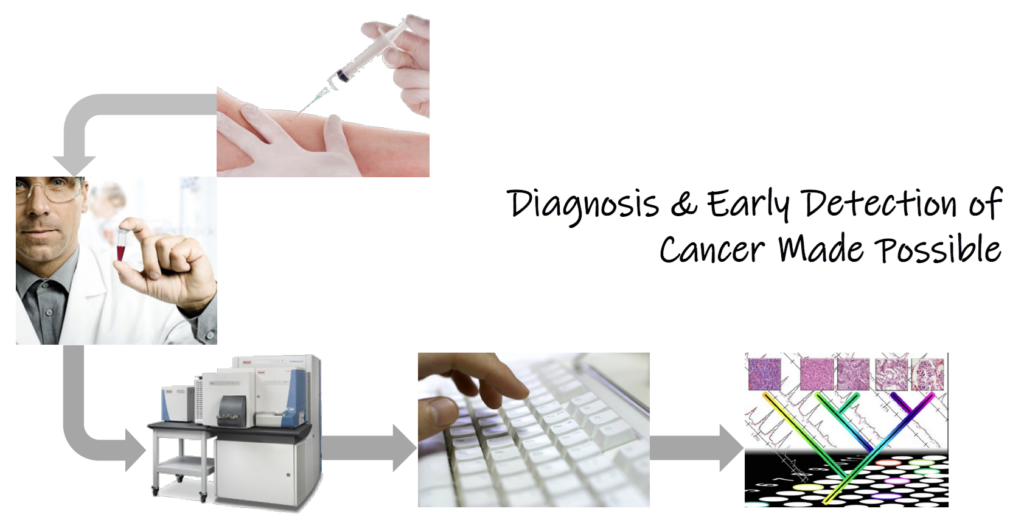
- The patients go to their doctors (this could be part of the annual checkup), hospitals, or labs where they give a blood sample, then the lab processes that blood using mass spectrometry proteomics or metabolomics and produces measurements of molecules found in the sample. The lab analysis costs roughly $100
- The patient, hospitals staff, the doctors, or the labs staff upload those measurements (an excel file with a column filled with numbers representing its serum) to our website from anywhere around the world.
- We take those measurements and run our proprietary algorithm using our vetted processes to derive diagnosis and early detection.
Inside Look at Our Method
This is a software solution that will leverage the vast, national and international, network of Metabolomics labs. Only an absolute minimal cost is needed to to launch this service! All that is required is a unique identifier associated with the Metabolomics measurements / profile of a patient. We take those measurements and process them along with our preestablished baseline for that type of cancer. This is how: We will build a master cladogram – for each type of cancer– that has anywhere between 500 to 1000 healthy patients and a similar number of patients with cancer. This is to establish a baseline that encompasses enough variations that are found within the general population.
For example, for prostate cancer we will have 2000 men of various demographics. We will process their metabolomics data using our algorithm.
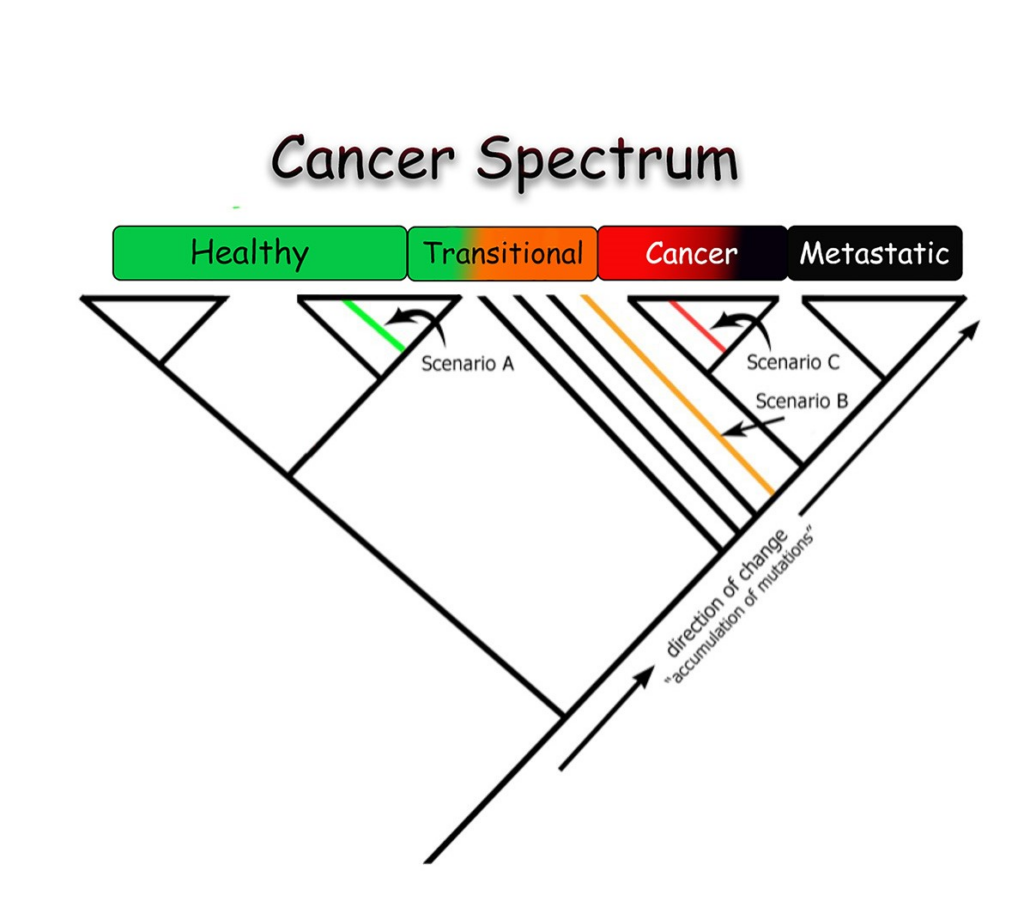
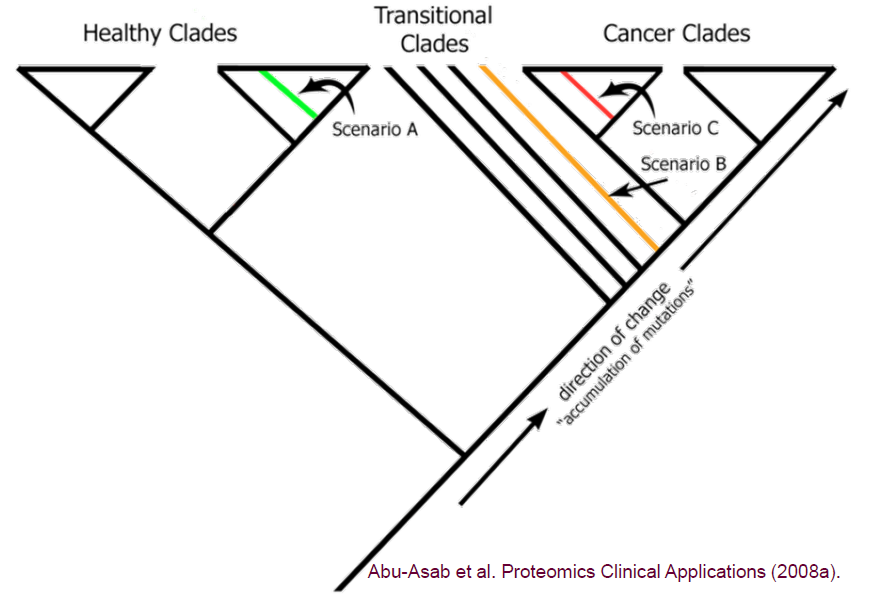
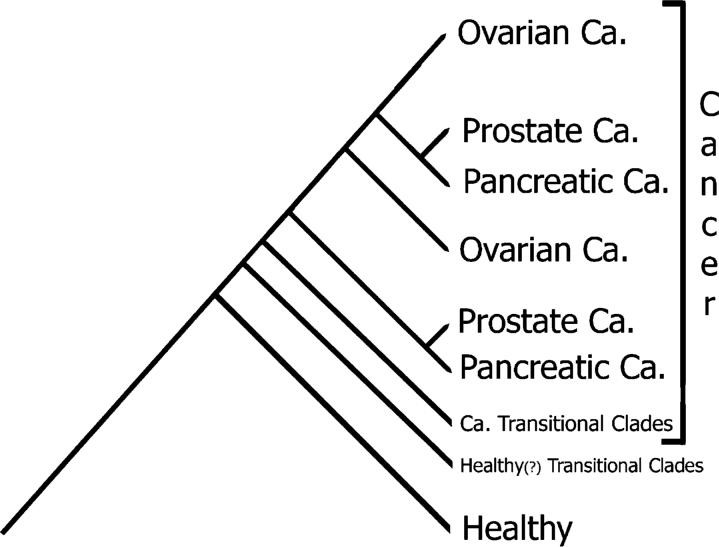
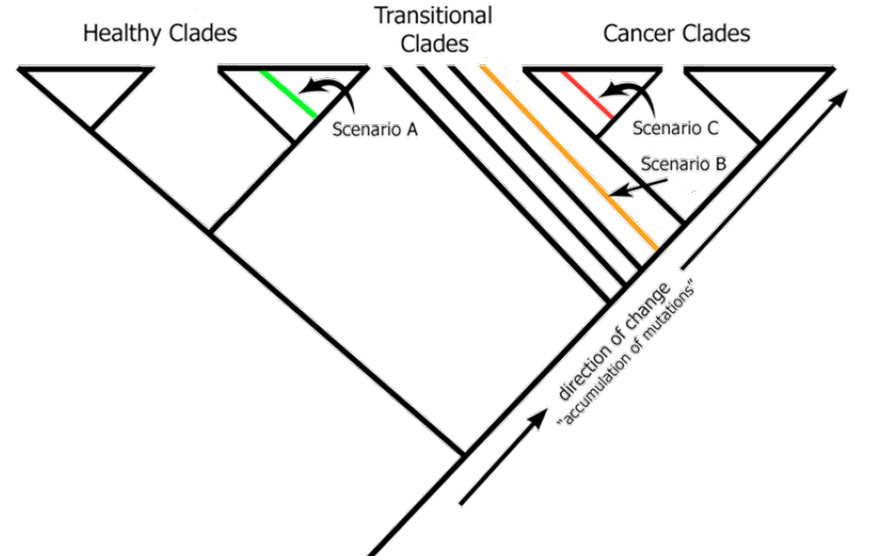
When we receive a new unknown specimen, we will add it to this universe and reprocess again. There are three potential outcomes depending on where the new unknown specimen appears in the cladogram: healthy, transitional, and cancerous.
This enables us to diagnose and achieve early detection.
In addition, we have the ability to run the measurements of that same drop of serum of a patient with each population from each cladogram representing each type of cancer. The end result is a non-invasive, holistic cancer screening with one lab visit. This is the compound benefit that we can offer off the bat to our customers.
Business Paths Forward
At this juncture, we see two paths forward:
1. FDA Approval
We need to raise $1M to secure an FDA approval for screening for one cancer type. The $1M will cover the cost of:
| $100k legal and application fees. |
| $200k to $500k to conduct a new clinical study to satisfy FDA’s potential requirements |
| $200k for the creation of the master cladogram. |
| $200k to create a minimal functioning, cloud-native website, for the first year that we will use for diagnosis. |
FDA approval will enable insurance companies to pay for the screening and doctors to prescribe it to patients.
We will charge $250 per screening which includes $100 lab analysis to produce mass spectrometry proteomics or metabolomics data.
After a successful release and adoption of the first screening, we will repeat the same steps for the next cancer type until we are able to screen for the most common types of cancer.
2. Market Approach
Scenario A:
We need to raise $2M in order to create screenings for the five most common cancer types.
| $1M for 5 master cladograms: $200k for 2000 patients for each cladogram representing a specific cancer type. |
| $200k to create a minimal functioning, cloud-native website for the first year. |
| $800k for sales and marketing representatives for the first year. |
We will charge $250 per screening for cancer type which includes $100 lab analysis to produce mass spectrometry proteomics or metabolomics data.
We will charge $350 per screening for 5 cancer types which includes $100 lab analysis to produce mass spectrometry proteomics or metabolomics data.
Scenario B:
We need to raise $5M in order to create screenings for the 10 most common cancer types.
| $2M for 10 master cladograms: $200k for 2000 patients for each cladogram representing a specific cancer type |
| $500k to create a minimal functioning cloud-native website for the first year. |
| $2.5M to cover renting an office, and the hiring of 2 Cloud Engineers, and 4 Sales and marketing representatives for the first year. |
We will charge $250 per screening for one cancer type which includes $100 lab analysis to produce mass spectrometry proteomics or metabolomics data.
We will charge $450 per screening for 10 cancer types which includes $100 lab analysis to produce mass spectrometry proteomics or metabolomics data.
Target Markets
Once we have the ability to diagnose and offer early detection, we can reach out to:
- Hospitals and provide them with incentives to conduct these cancer screenings through our website.
- Laboratories specializing in blood analysis and provide them with incentives to provide cancer screening ability through our website.
- Insurance companies and provide them with incentives to offer these services for free to their customers as it will save them substantial cost down the road through early detection.
- Customers directly who are interested in monitoring their health and offer incentives to use our services.
We will start with the US market, but we have the ability to replicate these steps worldwide by creating master cladograms for each type of cancer for each major geographical region: Europe, Asia, Middle East, Africa, and South America.