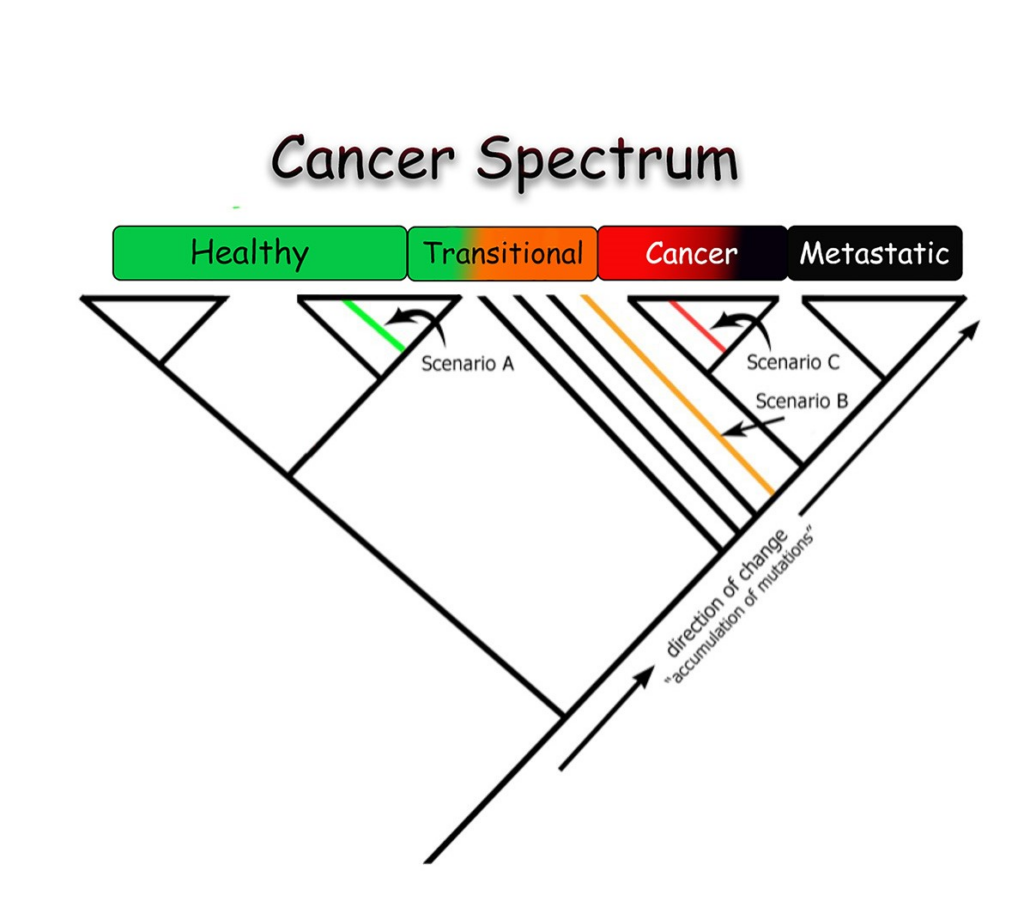
The cancer spectrum is a continuum that begins with what we refer to as the transition phase—the earliest cellular changes that eventually progress into a primary tumor (marked in red). The final stage is metastasis (marked in black), where the cancer spreads beyond its original site.
The cladogram shown below is constructed from real patient data and demonstrates that cancer progression can be modeled along this spectrum. This allows us to identify specimens in the transitional phase, enabling early detection, as well as accurately diagnosing both primary and metastatic tumors.
In short, we’re not just detecting cancer—we’re mapping its evolution.