The following cladograms are examples of the Phyloncology analysis of cancer data:
The Phyloncology Application: Cancer diagnosis and early detection made possible!
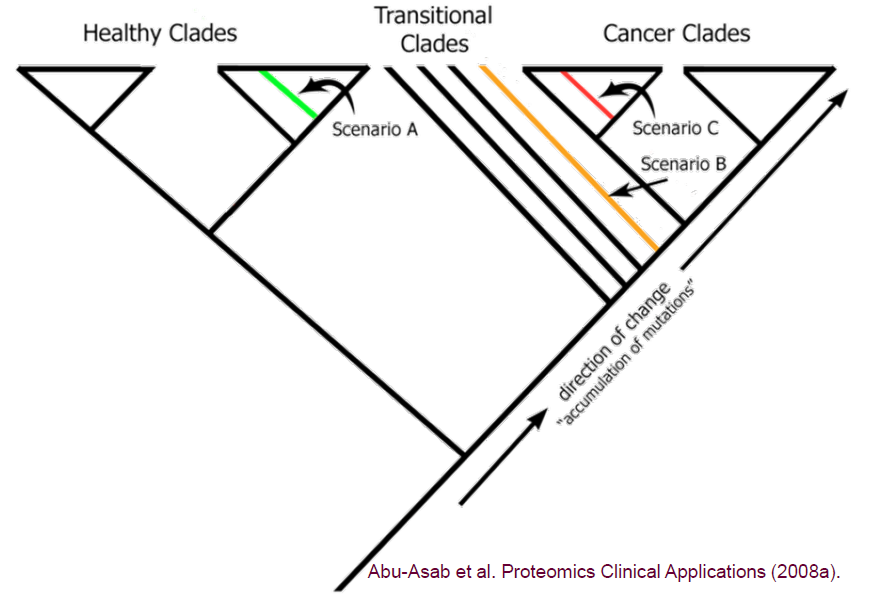
A cladogram representing a modeling tool for early detection and diagnosis based on the phylogenetic analysis of serum metabolomic and/or proteomic data. This model is based on our published data (see examples below). When applied in a clinical setting, the analysis of an unknown specimen could turn out to be healthy (scenario A), suspect (scenario B, early detection), or cancerous (scenario C, diagnosis).
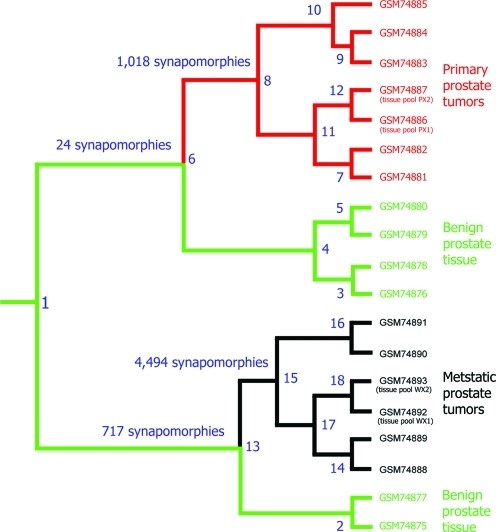
Separating the healthy from cancerous, and importantly separating primary from metastatic using gene-expression data!
A most parsimonious cladogram produced from dataset GDS1439 (http://www.ncbi.nlm.nih.gov/sites/entrez?db=gds). The dataset is comprised of six benign specimens, as well as seven primary and six metastatic prostate tumors. The cladogram shows a major bifurcation that delineates two clades; the first composed of all primary tumors and four benign specimens (node 6, supported by 24 synapomorphies), and the second composed of all metastatic tumors and two benign specimens (node 13, supported by 717 synapomorphies). A clade of primary tumors is delimited by 1,018 synapomorphies (node 8), whereas a clade of the metastatic tumors is delimited by 4,494 synapomorphies (node 15). Synapomorphies at nodes 6, 8, 13, and 15 are considered clonal (driver) expression aberrations. Pooled primary tumor specimens PX1 and PX2 grouped into a clade (node 12), whereas pooled metastatic specimens, WX1 and WX2 formed a clade (node 18).
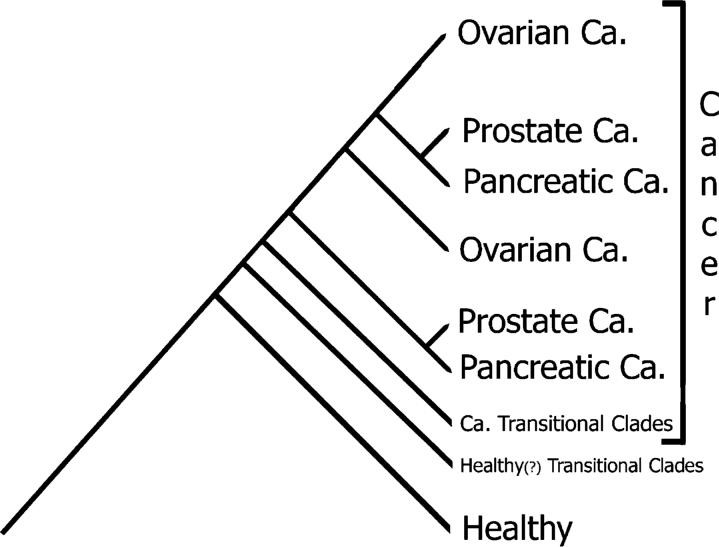
The Tree of Cancer: Separating various cancer types using serum metabolomics
Tree of Cancer. A phylogenetic analysis of serum proteomic data showing the relationship of three types of cancers. The dataset is composed of 460 specimens representing ovarian, pancreatic, and prostate cancers as well as noncancerous specimens. Specimens of each cancer type are classified into two major clades, a terminal and middle, as well as transitional clades between the healthy and cancerous. Healthy specimens are classified into a major healthy clade and transitional clades.
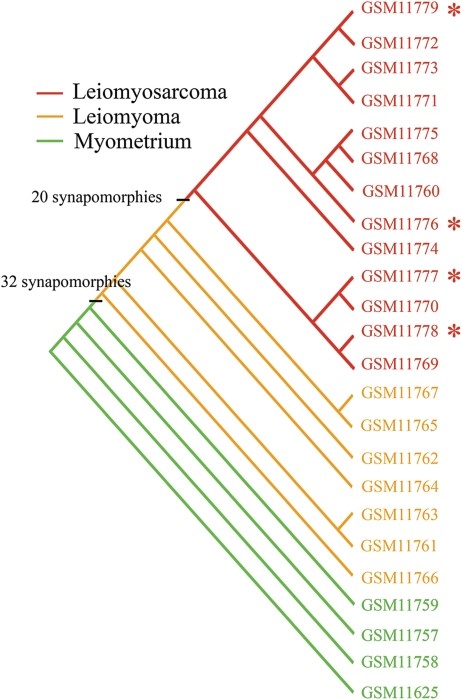
Distinguishing healthy & benign tissues from cancer on the basis of gene-expression
A cladogram of a parsimony phylogenetic analysis of microarray gene-expression data representing normal myometrium (n = 4), leiomyoma (n = 7), leiomyosarcoma (n = 9), and extrauterine leiomyosarcoma (n = 4) specimens. The leiomyomas and leiomyosarcomas form a clade defined by 32 synapomorphies. The leiomyosarcoma specimens form a terminal clade that is circumscribed by 20 synapomorphies . Asterisk (*) denotes extrauterine leiomyosarcomas.
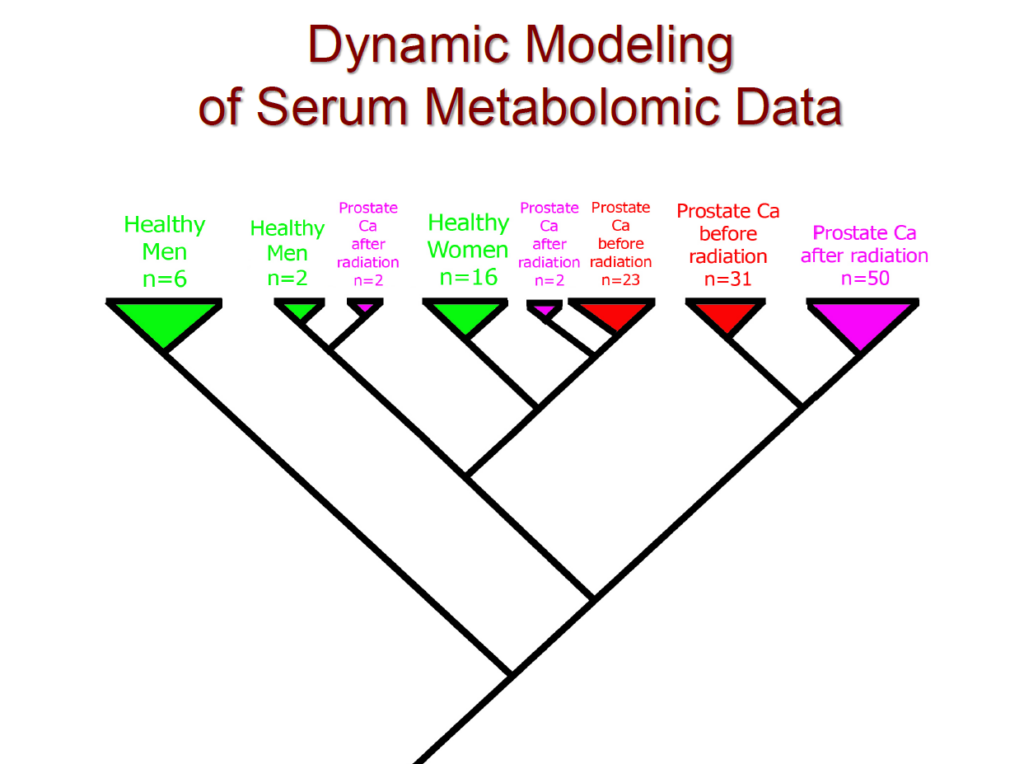
Serum metabolomics distinguish healthy men & women from prostate cancer patients (untreated and radiation treated)!
This cladogram is based on our own clinical trial of prostate cancer patients; it shows that serum metabolomics is useful tool for diagnosis and prognosis. The cladogram shows the phylogenetic analysis of serum metabolomic data representing healthy men (n=8), healthy women (n=16), prostate cancer before treatment (n=54), prostate cancer after radiation treatment (n=54). Notice that only two treated patients clustered with healthy men while the bulk of treated patients (n=50) formed their own cluster.